Opening and Plotting Rasters with GeoWombat#
This notebook covers the main options for opening and visualizing raster data with gw.open() and gw.config.update(). Topics include:
Opening a single file and inspecting properties
Band naming (explicit and sensor-based)
Opening specific bands
Resampling and changing resolution
Reprojecting to a different CRS
Subsetting by bounds
Setting nodata values
Scaling data
Stacking multiple files (
stack_dim='time'andstack_dim='band')Mosaicking multiple files
Plotting
Setup#
[37]:
import os
os.environ['CPL_LOG'] = '/dev/null'  # suppress GDAL warnings

import matplotlib.pyplot as plt
import geowombat as gw
from geowombat.data import (
    rgbn,
    rgbn_20160101,
    rgbn_20160401,
    rgbn_suba,
    rgbn_subb,
    l8_224078_20200518,
    l8_224077_20200518_B2,
    l8_224077_20200518_B3,
    l8_224077_20200518_B4,
)
1. Opening a Single File#
gw.open() is a context manager that opens rasters lazily using dask-backed xarray DataArrays. Data are not loaded into memory until you call .compute() or .gw.save().
[38]:
with gw.open(rgbn) as src:
    print(f'Shape: {src.shape}')
    print(f'Dims:  {src.dims}')
    print(f'CRS:   {src.crs}')
    print(f'Res:   {src.res}')
    print(f'Dtype: {src.dtype}')
    print(f'Bands: {src.band.values}')
    print(f'\nAttributes:')
    for k, v in src.attrs.items():
        print(f'  {k}: {v}')
Shape: (4, 403, 515)
Dims:  ('band', 'y', 'x')
CRS:   32618
Res:   (5.0, 5.0)
Dtype: uint8
Bands: [1 2 3 4]

Attributes:
  transform: (5.0, 0.0, 792988.0, 0.0, -5.0, 2050382.0)
  crs: 32618
  res: (5.0, 5.0)
  is_tiled: 1
  nodatavals: (nan, nan, nan, nan)
  _FillValue: nan
  scales: (1.0, 1.0, 1.0, 1.0)
  offsets: (0.0, 0.0, 0.0, 0.0)
  filename: /home/mmann1123/Documents/github/geowombat/src/geowombat/data/rgbn.tif
  resampling: nearest
  DataType: Generic
  AREA_OR_POINT: Area
  _data_are_separate: 0
  _data_are_stacked: 0
2. Band Naming#
By default, bands are numbered (1, 2, 3, …). You can assign meaningful names two ways.
2a. Explicit band names#
[39]:
with gw.open(rgbn, band_names=['red', 'green', 'blue', 'nir']) as src:
    print(f'Bands: {list(src.band.values)}')
    # Select by name
    print(f'NIR band shape: {src.sel(band="nir").shape}')
Bands: ['red', 'green', 'blue', 'nir']
NIR band shape: (403, 515)
2b. Sensor-based band names via gw.config.update(sensor=...)#
GeoWombat has built-in sensor configurations that auto-assign band names. Common sensors: 'rgbn', 'bgrn', 'l5', 'l7', 'l8', 's2', 'ps'.
[40]:
with gw.config.update(sensor='bgrn'):
    with gw.open(rgbn) as src:
        print(f'Bands: {list(src.band.values)}')
Bands: ['blue', 'green', 'red', 'nir']
3. Selecting Specific Bands#
Select bands after opening with .sel(band=...). The band_names parameter is for renaming bands, not selecting them.
[41]:
# Select a single band by index
with gw.open(rgbn) as src:
    band1 = src.sel(band=1)
    print(f'Single band shape: {band1.shape}')
    print(f'Dims: {band1.dims}')
Single band shape: (403, 515)
Dims: ('y', 'x')
[42]:
# Or open all bands and select after
with gw.open(rgbn, band_names=['red', 'green', 'blue', 'nir']) as src:
    rgb = src.sel(band=['red', 'green', 'blue'])
    print(f'RGB subset shape: {rgb.shape}')
    print(f'RGB bands: {list(rgb.band.values)}')
RGB subset shape: (3, 403, 515)
RGB bands: ['red', 'green', 'blue']
4. Resampling and Changing Resolution#
Use gw.config.update(ref_res=...) to change the output resolution. The resampling parameter controls the interpolation method.
Resampling choices: 'nearest', 'bilinear', 'cubic', 'cubic_spline', 'lanczos', 'average', 'mode', 'max', 'min', 'med', 'gauss'.
[43]:
# Original resolution
with gw.open(rgbn) as src:
    print(f'Original: {src.shape}, res={src.res}')

# Downsample to 20m
with gw.config.update(ref_res=20):
    with gw.open(rgbn, resampling='bilinear') as src:
        print(f'20m:      {src.shape}, res={src.res}')

# Non-square pixels
with gw.config.update(ref_res=(10, 20)):
    with gw.open(rgbn, resampling='cubic') as src:
        print(f'10x20m:   {src.shape}, res={src.res}')
Original: (4, 403, 515), res=(5.0, 5.0)
20m:      (4, 100, 128), res=(20.0, 20.0)
10x20m:   (4, 100, 257), res=(10.0, 20.0)
5. Reprojecting to a Different CRS#
Use gw.config.update(ref_crs=...) with an EPSG code or a reference image.
Note: When changing CRS units (e.g., meters to degrees), you must also set ref_res in the target CRS units — geowombat does not auto-convert resolution across unit systems.
[44]:
with gw.open(rgbn) as src:
    print(f'Original CRS: {src.crs}')
    print(f'Original res: {src.res}')

# Reproject to a different UTM zone (same unit system — meters)
with gw.config.update(ref_crs=32617):
    with gw.open(rgbn) as src:
        print(f'\nReprojected CRS: {src.crs}')
        print(f'Shape: {src.shape}')
        print(f'Res: {src.res}')

# Reproject to EPSG:4326 (degrees) — must set ref_res in degrees
# ~0.00005 degrees is roughly 5m at mid-latitudes
with gw.config.update(ref_crs=4326, ref_res=0.00005):
    with gw.open(rgbn) as src:
        print(f'\nWGS84 CRS: {src.crs}')
        print(f'Shape: {src.shape}')
        print(f'Res: {src.res}')
Original CRS: 32618
Original res: (5.0, 5.0)

Reprojected CRS: 32617
Shape: (4, 424, 533)
Res: (5.0, 5.0)

WGS84 CRS: 4326
Shape: (4, 370, 493)
Res: (5e-05, 5e-05)
[45]:
# Use a reference image to match CRS and resolution
with gw.config.update(ref_image=l8_224078_20200518):
    with gw.open(rgbn) as src:
        print(f'CRS (from ref): {src.crs}')
        print(f'Res (from ref): {src.res}')
CRS (from ref): 32621
Res (from ref): (30.0, 30.0)
6. Subsetting by Bounds#
Clip the output to a bounding box using bounds or gw.config.update(ref_bounds=...).
Bounds format: (left, bottom, right, top) in the output CRS.
[46]:
# Get the full extent first
with gw.open(rgbn) as src:
    print(f'Full extent: {src.shape}')
    print(f'Y range: {float(src.y.min()):.0f} to {float(src.y.max()):.0f}')
    print(f'X range: {float(src.x.min()):.0f} to {float(src.x.max()):.0f}')

# Subset with bounds (left, bottom, right, top)
with gw.open(rgbn, bounds=(793000, 2049000, 794000, 2050000)) as src:
    print(f'\nSubset: {src.shape}')
    print(f'Y range: {float(src.y.min()):.0f} to {float(src.y.max()):.0f}')
    print(f'X range: {float(src.x.min()):.0f} to {float(src.x.max()):.0f}')
Full extent: (4, 403, 515)
Y range: 2048370 to 2050380
X range: 792990 to 795560

Subset: (4, 200, 200)
Y range: 2049002 to 2049998
X range: 793002 to 793998
[47]:
# Or use ref_bounds from config (useful when opening multiple files)
with gw.config.update(ref_bounds=(793000, 2049000, 794000, 2050000)):
    with gw.open(rgbn) as src:
        print(f'Config bounds subset: {src.shape}')
Config bounds subset: (4, 200, 200)
7. Setting Nodata Values#
The nodata parameter overrides the file’s internal nodata value. This is useful when files have incorrect or missing nodata metadata.
[48]:
# Check the file's built-in nodata
with gw.open(l8_224078_20200518) as src:
    print(f'Default nodata: {src.attrs.get("nodatavals")}')

# Override with a specific nodata value
with gw.open(l8_224078_20200518, nodata=0) as src:
    print(f'Overridden nodata: {src.attrs.get("nodatavals")}')

# Or set via config (takes highest precedence)
with gw.config.update(nodata=0):
    with gw.open(l8_224078_20200518) as src:
        print(f'Config nodata: {src.attrs.get("nodatavals")}')
Default nodata: (nan, nan, nan)
Overridden nodata: (0, 0, 0)
Config nodata: (0, 0, 0)
8. Scaling Data#
Use scale_data=True to apply gain/offset: scaled = data * scale_factor + offset.
Scale values come from (in priority order):
gw.config.update(scale_factor=..., offset=...)gw.open(scale_factor=..., offset=...)File metadata
[49]:
# No scaling (raw DN values)
with gw.open(rgbn) as src:
    print(f'Raw dtype: {src.dtype}')
    print(f'Raw range: {float(src.min()):.0f} - {float(src.max()):.0f}')

# Scale to 0-1 reflectance-like values
with gw.open(rgbn, scale_data=True, scale_factor=1/255.0) as src:
    print(f'Scaled dtype: {src.dtype}')
    print(f'Scaled range: {float(src.min()):.3f} - {float(src.max()):.3f}')
Raw dtype: uint8
Raw range: 0 - 255
Scaled dtype: float64
Scaled range: 0.000 - 1.000
9. Stacking Multiple Files#
When given a list of files, gw.open() stacks them along either 'time' or 'band' dimension.
9a. Time stacking (stack_dim='time', default)#
Each file becomes a time step. Output shape: (time, band, y, x).
[50]:
with gw.open(
    [rgbn_20160101, rgbn_20160401],
    stack_dim='time',
) as src:
    print(f'Shape: {src.shape}')
    print(f'Dims:  {src.dims}')
    print(f'Time:  {src.time.values}')
Shape: (2, 4, 403, 515)
Dims:  ('time', 'band', 'y', 'x')
Time:  [1 2]
[51]:
# With custom time names
with gw.open(
    [rgbn_20160101, rgbn_20160401],
    stack_dim='time',
    time_names=['2016-01-01', '2016-04-01'],
) as src:
    print(f'Time: {src.time.values}')
Time: ['2016-01-01' '2016-04-01']
9b. Band stacking (stack_dim='band')#
Bands from each file are concatenated into a single band dimension. Output shape: (band, y, x) with more bands.
[52]:
with gw.open(
    [rgbn_20160101, rgbn_20160401],
    stack_dim='band',
) as src:
    print(f'Shape: {src.shape}')
    print(f'Dims:  {src.dims}')
    print(f'Bands: {src.band.values}')
Shape: (8, 403, 515)
Dims:  ('band', 'y', 'x')
Bands: [1 2 3 4 5 6 7 8]
9c. Stacking single-band files#
Stack individual band files into a multi-band image.
[53]:
with gw.open(
    [l8_224077_20200518_B2, l8_224077_20200518_B3, l8_224077_20200518_B4],
    stack_dim='band',
    band_names=['blue', 'green', 'red'],
) as src:
    print(f'Shape: {src.shape}')
    print(f'Bands: {list(src.band.values)}')
Shape: (3, 1515, 2006)
Bands: ['blue', 'green', 'red']
9d. Controlling overlap extent with bounds_by#
When stacking files with different extents, bounds_by controls the output:
|
Behavior |
|---|---|
|
Use bounds of the first (or |
|
Use the overlapping area only |
|
Use the combined extent of all files |
[54]:
# rgbn_suba and rgbn_subb cover different extents, so stacking
# them is expected to trigger an alignment warning. Wrap the calls
# in gw.config.update(ignore_warnings=True) to silence it.
with gw.config.update(ignore_warnings=True):
    # Union: maximum extent
    with gw.open(
        [rgbn_suba, rgbn_subb],
        stack_dim='band',
        bounds_by='union',
    ) as src:
        print(f'Union shape: {src.shape}')

    # Intersection: minimum extent
    with gw.open(
        [rgbn_suba, rgbn_subb],
        stack_dim='band',
        bounds_by='intersection',
    ) as src:
        print(f'Intersection shape: {src.shape}')
Union shape: (8, 431, 570)
Intersection shape: (8, 431, 570)
10. Mosaicking#
Use mosaic=True to spatially merge adjacent/overlapping images into a single raster instead of stacking them. The overlap parameter controls how overlapping pixels are resolved: 'max', 'min', or 'mean'.
[55]:
with gw.open(
    [rgbn_suba, rgbn_subb],
    mosaic=True,
    overlap='max',
) as src:
    print(f'Mosaic shape: {src.shape}')
    print(f'Dims: {src.dims}')
Mosaic shape: (4, 212, 276)
Dims: ('band', 'y', 'x')
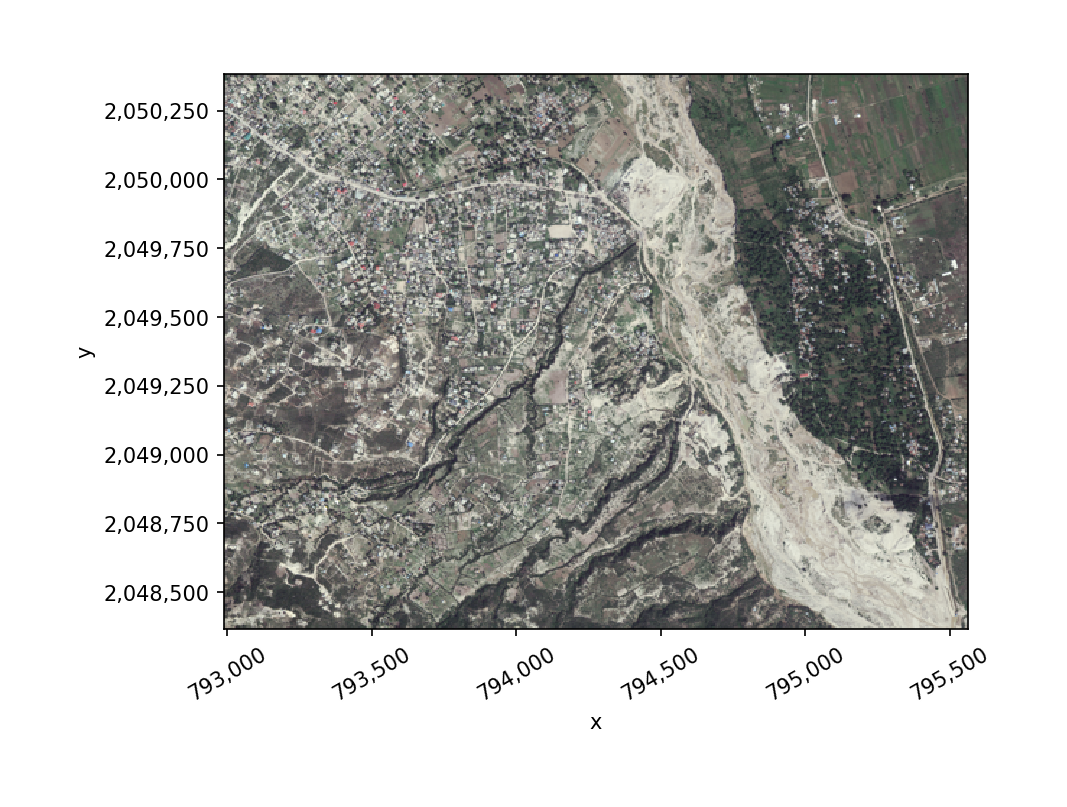
11. Plotting#
Use src.gw.imshow() for quick visualization. It wraps xarray’s .plot.imshow() with tidier axes. Only 1-band or 3-band arrays can be plotted.
RGB plot#
[56]:
with gw.open(rgbn) as src:
    # Select bands 3, 2, 1 (RGB order) for display
    src.sel(band=[3, 2, 1]).gw.imshow()
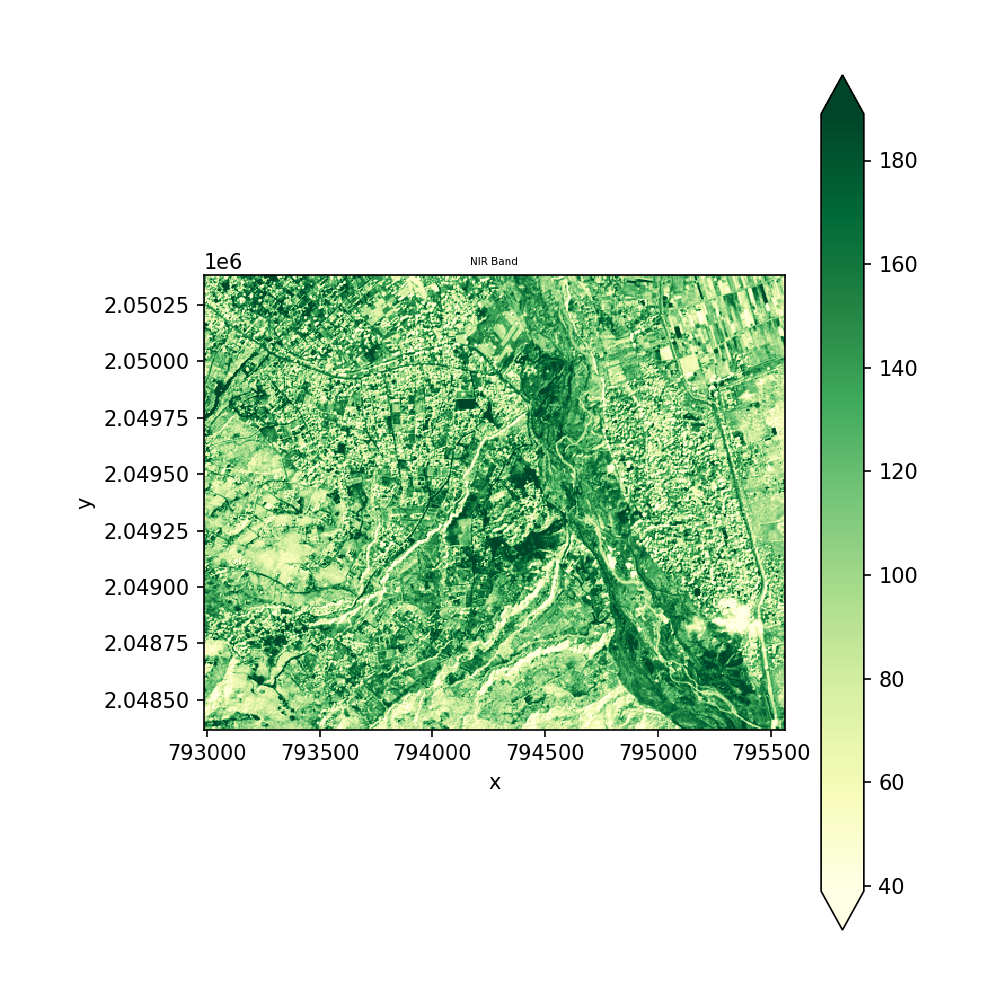
Single band plot#
[57]:
fig, ax = plt.subplots(figsize=(6, 6))
with gw.open(rgbn, band_names=['red', 'green', 'blue', 'nir']) as src:
    src.sel(band='nir').plot(ax=ax, cmap='YlGn', robust=True)
    ax.set_title('NIR Band')
    ax.set_aspect('equal')
plt.tight_layout()
plt.show()
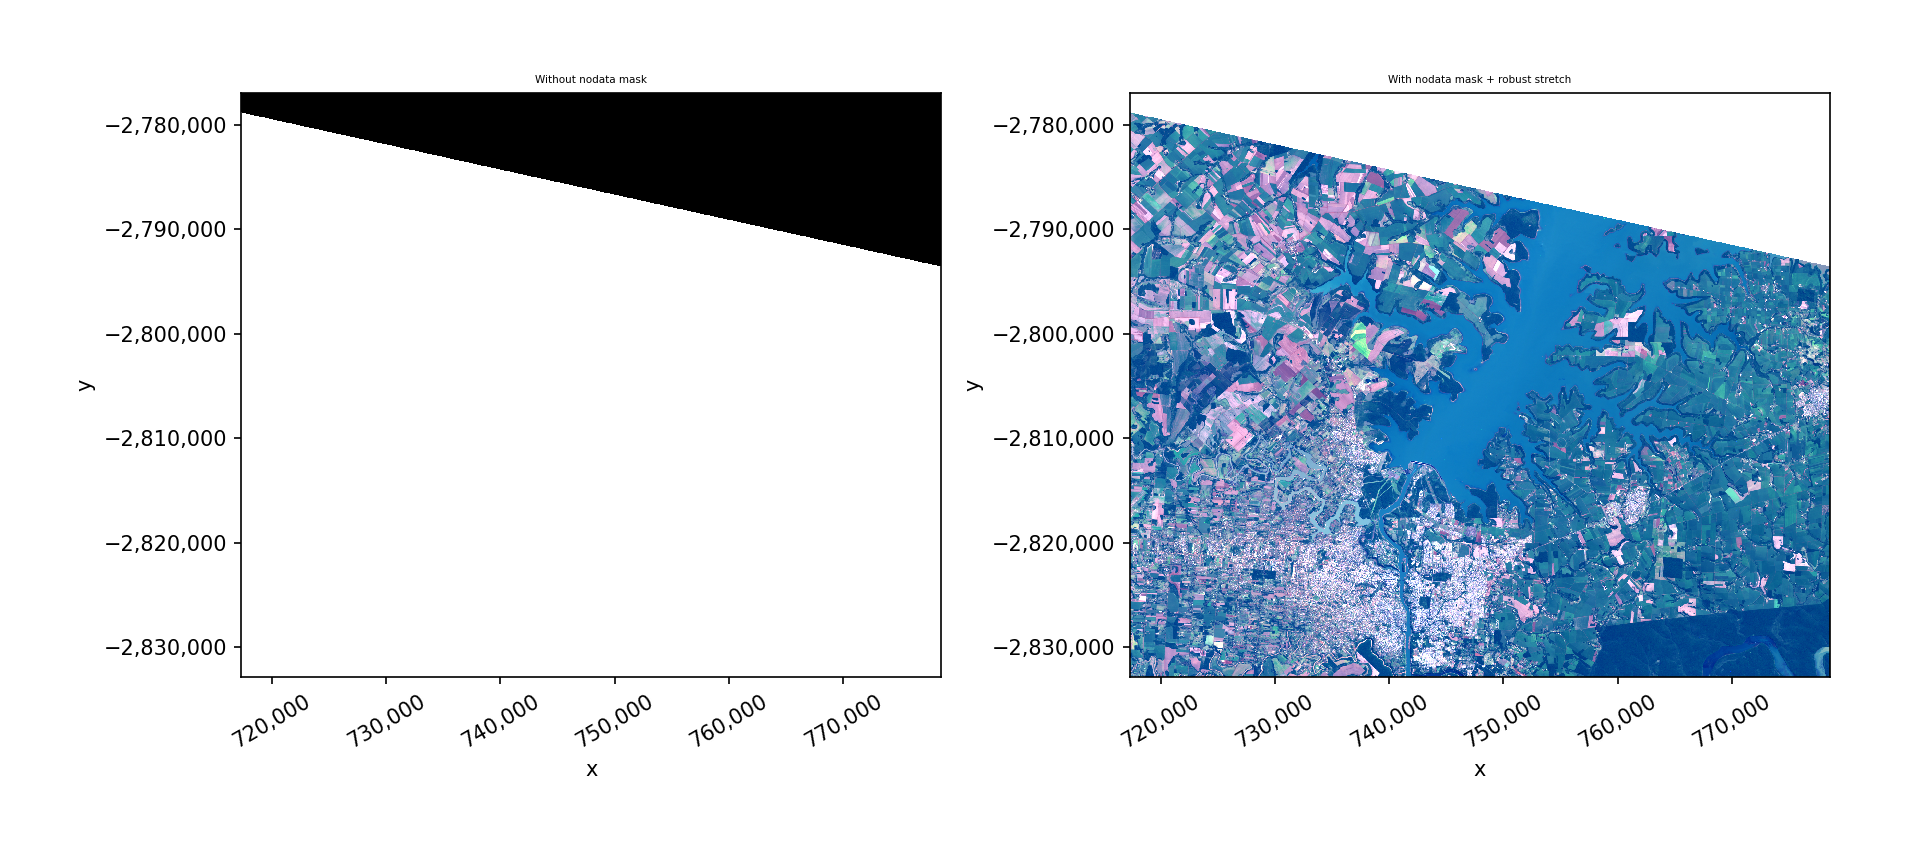
Plot with robust=True and nodata masking#
[58]:
fig, axes = plt.subplots(1, 2, figsize=(12, 5))

with gw.open(l8_224078_20200518, nodata=0) as src:
    # Without masking
    src.sel(band=[3, 2, 1]).gw.imshow(ax=axes[0])
    axes[0].set_title('Without nodata mask')

    # With nodata masking (mask=True hides nodata pixels)
    src.sel(band=[3, 2, 1]).gw.imshow(mask=True, nodata=0, robust=True, ax=axes[1])
    axes[1].set_title('With nodata mask + robust stretch')

plt.tight_layout()
plt.show()
Clipping input data to the valid range for imshow with RGB data ([0..1] for floats or [0..255] for integers). Got range [0..24147].
Flip band order#
If your bands are in BGR order, use flip=True to reverse them for display.
[59]:
with gw.open(rgbn) as src:
    src.sel(band=[1, 2, 3]).gw.imshow(flip=True)

gw.config.update() Reference#
The config context manager controls global settings that override gw.open() arguments.
Parameter |
Description |
Example |
|---|---|---|
|
Auto-assign band names |
|
|
Reference file for CRS, res, and bounds |
|
|
Output CRS (EPSG code or file path) |
|
|
Output resolution in CRS units |
|
|
Output bounding box (left, bottom, right, top) |
|
|
Nodata value (highest precedence) |
|
|
Scale factor for |
|
|
Offset for |
|
Config settings can be combined:
with gw.config.update(ref_crs=4326, ref_res=0.001, nodata=0):
    with gw.open('image.tif', resampling='bilinear') as src:
        ...
gw.open() Reference#
Parameter |
Default |
Description |
|---|---|---|
|
(required) |
File path, list of paths, or glob pattern ( |
|
|
Custom band names |
|
|
Custom time labels when stacking |
|
|
Stack dimension: |
|
|
Spatial subset: |
|
|
Extent strategy: |
|
|
Resampling method |
|
|
Merge files spatially instead of stacking |
|
|
Mosaic overlap handling: |
|
|
Override nodata value |
|
|
Scale multiplier |
|
|
Additive offset |
|
|
Apply scaling: |
|
|
Force output data type (e.g., |
|
|
Dask workers for parallel I/O |